
您当前的位置:首页 » 产品展示 » 频谱分析仪 » RSA603A频谱分析仪,泰克RSA603A,RSA603A
| 产品名称: | RSA603A频谱分析仪,泰克RSA603A,RSA603A |
| 产品型号: | RSA603A |
| 品牌: | |
| 产品数量: | |
| 产品单价: | 面议 |
| 日期: | 2024-09-19 |
RSA603A频谱分析仪,泰克RSA603A,RSA603A的详细资料
RSA603A频谱分析仪,泰克RSA603A,RSA603A:且准确的 RSA603A和 USB 频谱分析仪以可视化方式检定您的设备或组件,配有可协助完成无线集成、EMI 和 IoT 项目的功能。
通过 RSA 系列的强大实时架构发现困难、难以发现的问题。借助 DPX® 技术,您可以看见几乎无法通过传统频谱分析仪看见的 RF 特征。
RSA603A频谱分析仪,泰克RSA603A,RSA603A:
RSA600 由全系列泰克实时频谱分析仪采用的同款软件—SignalVu® Essentials 软件提供技术支持。提供的测试与分析功能,您可以保存,自定义并与您的同事分享。超过 15 个软件包涵盖常见无线标准、频谱管理、脉冲测量等。
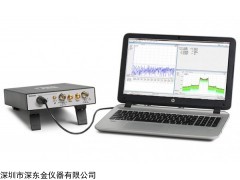
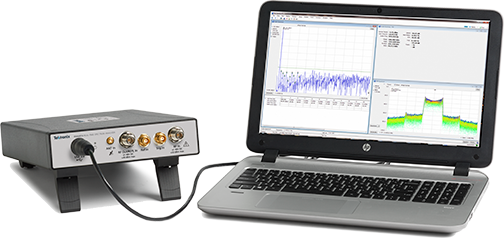
RSA600 体积轻巧,便于带入工作台或实验室。它由笔记本电脑或平板电脑驱动,非常灵活与方便。您可以根据您的需要选择合适的显示器与连接方式。
凭借对 WLAN、蓝牙、LTE 等的调制分析,RSA600 以低成本实现简单的设计检定、故障排除和认证。内部跟踪发生器用于检定 RF 组件和系统。
The RSA600A Series USB spectrum analyzers offer high bandwidth laboratory spectrum analysis in a small, very transportable package.
Features and benefits- 9 kHz to 3.0/7.5 GHz frequency range covers a broad range of analysis needs
- 40 MHz acquisition bandwidth enables real time analysis for transient capture and vector analysis
- Amplitude accuracy of 0.2 dB to 3 GHz (95% confidence)
- Standard GPS/GLONASS/Beidou receiver
-
Optio
nal tracking generator for gain/loss, antenna and cable measurements - Streaming capture can be used to record and play back long term events
- SignalVu-PC software offers real time signal processing with DPX Spectrum/Spectrogram to minimize time spent finding transient problems
- 100 μsec minimum signal duration with probability of intercept ensure you see problems first time, every time
- Application programming interface included for development of custom programs
- Accessories including tablet PC, calibration kits, adapters and phase-stable cables offer a complete solution for design, characterization, and manufacturing
- Characterization of RF devices, subsystems, and systems
- Manufacturing test
- Mobile field operations
The RSA600 series brings real-time spectrum analysis and wide analysis bandwidth to solving the problems of engineers who need to characterize, validate and manufacture their designs. The heart of the system is the USB-ba
The optio
The RSA600 series operates with SignalVu-PC, a powerful program used as the basis of Tek's traditio
| General signal analysis |
Des |
|---|---|
| Spectrum analyzer | Spans from 100 Hz to 7.5 GHz, 3 traces + math and spectrogram trace, 5 markers with power, relative power, integrated power, power density and dBc/Hz functions |
| DPX spectrum/spectrogram | Real time display of spectrum with probability of intercept of 100 usec signals in up to 40 MHz span |
| Amplitude, frequency, phase vs. time, RF I and Q vs. time | Basic vector analysis functions |
| Time overview/navigator | Enables easy setting of acquisition and analysis times for deep analysis in multiple domains |
| Spectrogram | Analyze and re-analyze your signal in 2-D or 3-D waterfall display |
| AM/FM listening | Hear and record to file FM and AM signals |
| Signal recording | Record 40 MHz bandwidth for re-analysis in all domains including real time spectrum analysis (requires application SV56 for Playback) |
| Analog modulation analysis |
Des |
| AM, FM, PM analysis | Measures key AM, FM, PM parameters |
| RF measurements |
Des |
| Spurious measurement | User-defined limit lines and regions provide automatic spectrum violation testing across the entire range of the instrument. |
| Spectrum emission mask | User-set or standards-specific masks. |
| Occupied bandwidth | Measures 99% power, -xdB down points. |
| Channel power and ACLR | Variable channel and adjacent/alternate channel parameters. |
| MCPR | Sophisticated, flexible multi-channel power measurements. |
| CCDF | Complementary Cumulative Distribution Function plots the statistical variations in signal level. |
| Signal strength with audio tone |
Measures signal strength and displays a spectrum and signal strength bar for interference hunting and signal quality e |
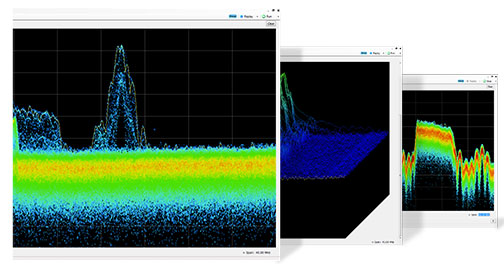
With 40 MHz of real-time bandwidth, the unique DPX spectrum/spectrogram shows you every instance of an interfering or unknown signal, even down to 100 μs in duration. The following image shows a WLAN transmission (green and orange), and the narrow signals that repeat across the screen are a Bluetooth access probe. The spectrogram (upper part of the screen) clearly separates these signals in time to show any signal collisions.

Finding unexpected signals is easy with unattended mask monitoring. A mask can be created on the DPX spectrum display, and actions taken upon every violation, including stop, save a picture, save acquisition, or send an audible a

SignalVu-PC application-specific licenses
SignalVu-PC offers a wealth of application-oriented options including:
- General-purpose modulation analysis (27 modulation types including 16/32/64/256 QAM, QPSK, O-QPSK, GMSK, FSK, APSK)
- Buetooth® analysis of Low Energy, Basic Rate and Enhanced Data Rate
- P25 analysis of phase I and phase 2 signals
- WLAN analysis of 802.11a/b/g/j/p, 802.11n, 802.11ac
-
LTE™ FDD and TDD ba
se Station (eNB) Cell ID & RF measurements - Mapping
- Pulse analysis
- AM/FM/PM/Direct Audio Measurement including SINAD, THD
- Playback of recorded files, including complete analysis in all domains
- Signal classification and survey
See the separate SignalVu-PC data sheet for complete details and ordering information. Selected applications are illustrated below.
General purpose modulation analysis
SignalVu-PC application SV21 bundles 27 different modulation types into a single analysis package and offers co

RSA603A频谱分析仪,泰克RSA603A,RSA603A:
Bluetooth
With application SV27 you can perform Bluetooth SIG standard-ba

APCO 25
SignalVu-PC application SV26 enables analysis of APCO P25 signals. The following image shows a Phase II HCPM signal being mo

LTE
Application SV28 enables the following LTE ba
- Cell ID
- Channel power
- Occupied bandwidth
- Adjacent channel leakage ratio (ACLR)
- Spectrum emission mask (SEM)
- Transmitter off power for TDD
The measurements follow the definition in 3GPP TS Version 12.5 and support all ba
The Cell ID preset displays the Primary Synchro
The illustration below shows spectral mo

WLAN 802.11a/b/g/j/p/n/ac
With options SV23, 24 and 25, sophisticated WLAN measurements are easy. On the 802.11ac (20 MHz) signal shown, the spectrogram shows the initial pilot sequence followed by the main signal burst. The modulation is automatically detected as 64 QAM for the packet and displayed as a constellation. The data summary indicates an EVM of -37.02 dB RMS, and burst power is measured at -17.32 dBm. SignalVu-PC applications are available for 802.11a/b/j/g/p, 802.11n, and 802.11ac to 40 MHz bandwidth.
RSA603A频谱分析仪,泰克RSA603A,RSA603A:
Playback
Application SV56, Playback of recorded signals, can reduce hours of watching and waiting for a spectral violation to minutes at your desk reviewing recorded data.
Recording length is limited o
In the illustration below, the FM band is being replayed, with a mask applied to detect spectral violations, simultaneous with listening to the FM signal at the center frequency of 92.3 MHz.
RSA603A频谱分析仪,泰克RSA603A,RSA603A: